Creating an Ameritas IUL Illustration from the Leveraging Spreadsheet
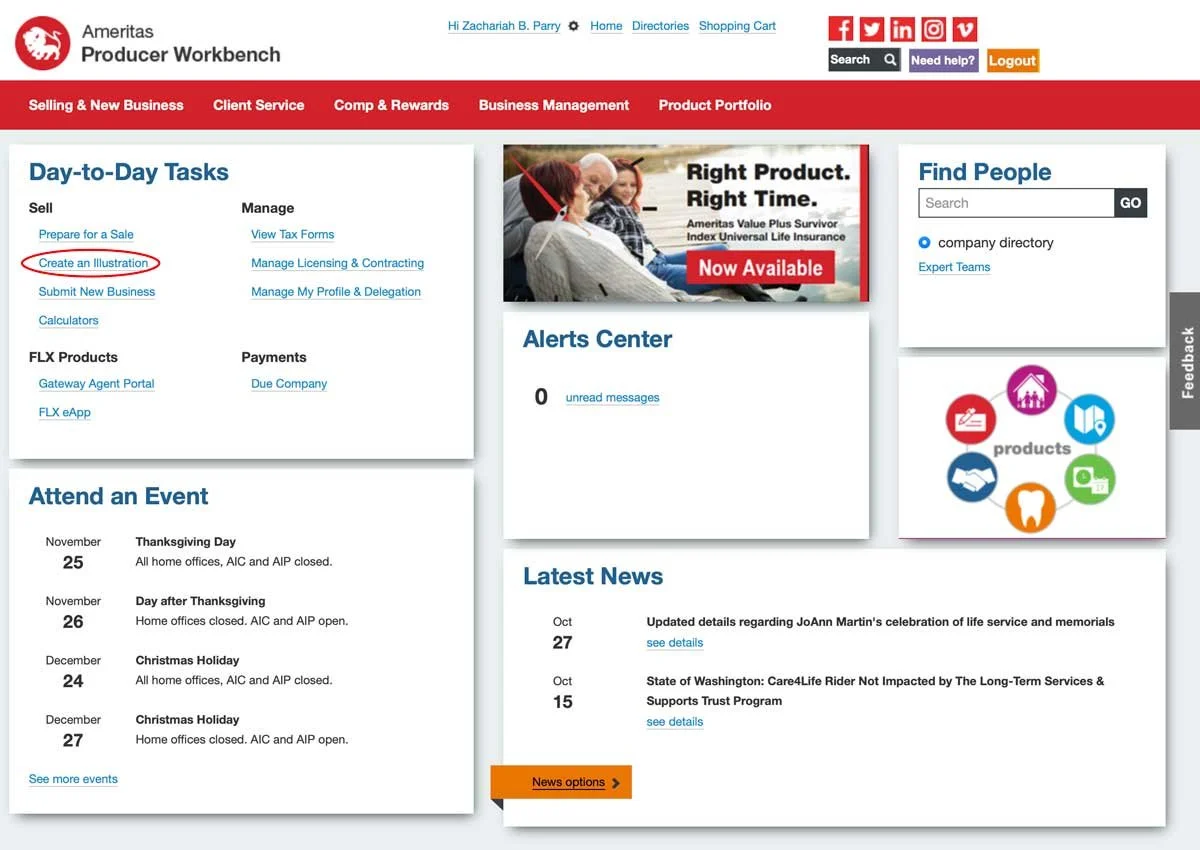
Once you’ve logged in, you should be at the Producer Workbench main page. Click on “Create an Illustration”:
Click on “Launch LifeDesigns now >>”:

Click the “Login” button:

This will bring up a new window. Click “Clients and Cases”:

Click on “New” on the right:

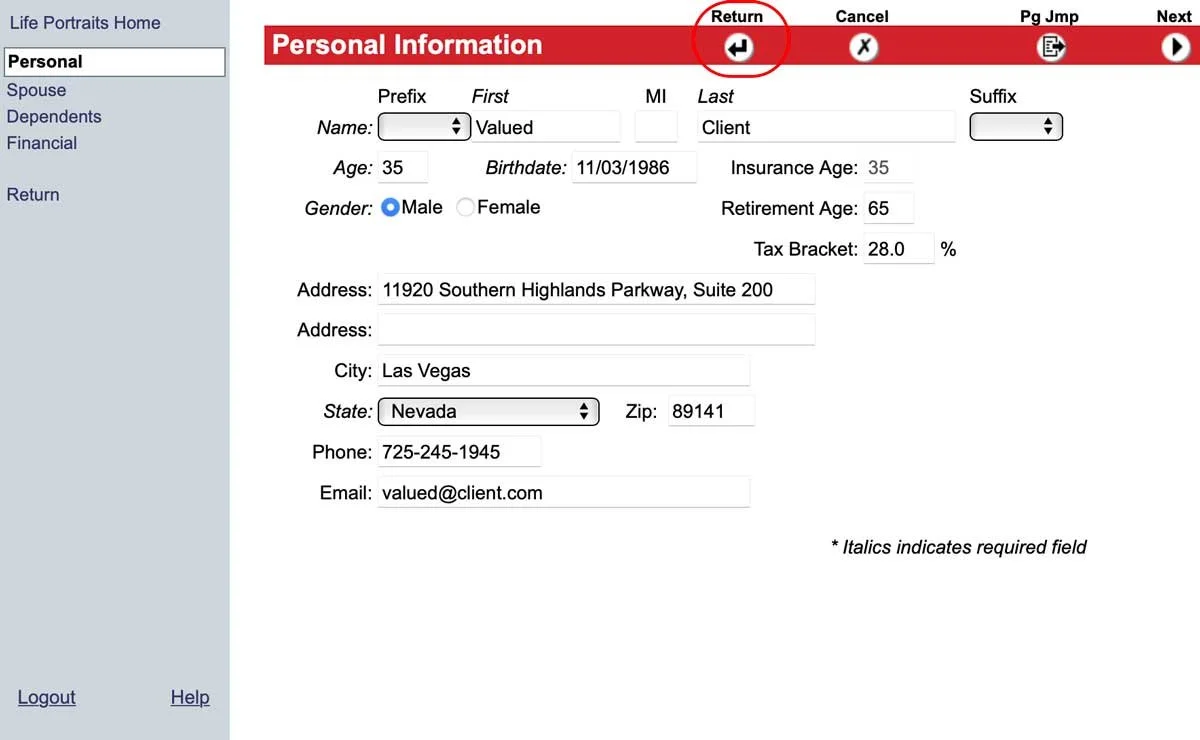
This will bring up the illustration software for a new case. You will start on the “Personal” tab (the tabs are on the left). You will need to insert your client’s information here.
The tax bracket is something you calculated and submitted when you originally requested the illustration spreadsheet. If you have forgotten what the tax bracket was, you will find it on the intake tab of the spreadsheet.
Fill out the form:

Once it is filled out, click the “Return” button at the top:
This just creates the client. We still have to create the illustration. When you click “Return,” it will take you back to the “Clients and Cases” page.
Make sure your new client is selected up top, then on the bottom box, select “New” then “Basic Illustration” to create a new case for that client:

The “Product Illustrations” page will come up. Most of the fields here you are going to leave as they are. But you do want to change the following fields as follows:
Class: put whatever the leveraging spreadsheet was built on (which you selected when you filled out the form). That information is captured in the “input” tab of the spreadsheet if you’ve forgotten.
Plan: Select “Americas Growth Index UL.”
Option: You are going to select “B.” (Option “A” is level death benefit; Option “B” is increasing death benefit.)
Amount: This is going to be the amount of premium going in in year one. This will match the spreadsheet tab labeled “AIUL” for this client.
Mode: Select “Annual.” In those cases where the client is not paying in a lump sum, but will be paying the first premium over time, then you will want to select “Monthly” and divide the total premium in “Amount” by 12.
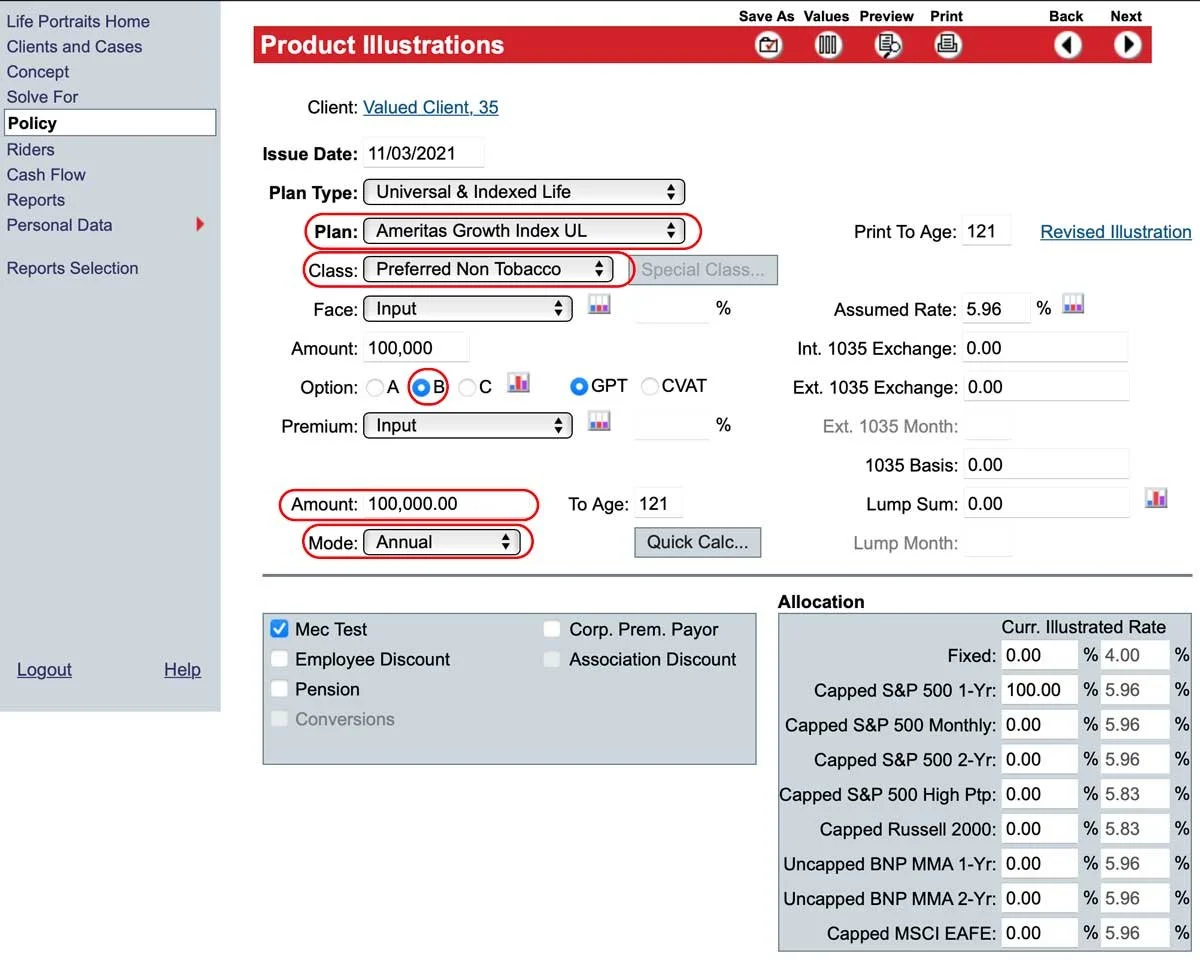
Once all this has been input, select the little chart icon next to Option B:

This will bring up a page that shows Option B from their current age to age 121.
You will change the “To Age” number from 121, depending on their age.
If the client is younger than 55, use “65” as the new age. If they are 55 or older, add 15 years to their age and use that number.
In this example case, the client is 35, so we’re going to replace “121” with “65.”
When we do that, it will input figures in the second row.
You need to make sure the Code for row 2 is “A,” the “Type” is “Level,” and the “To Age” is 121.
Once you’ve completed these fields, click on the “Return” button at the top of the page.

This will bring you back to the “Product Illustrations” page. This is where we will later need to do a little trial and error to get the product right.
The first thing you are going to do is input a death benefit in the first “Amount” field that is going to be within the ballpark of death benefit for the amount of premium going in (you don’t really have to be close, but the closer you are on the first time, the fewer steps this will be).
Once you have a number there, you are going to click on “Riders” on the left:

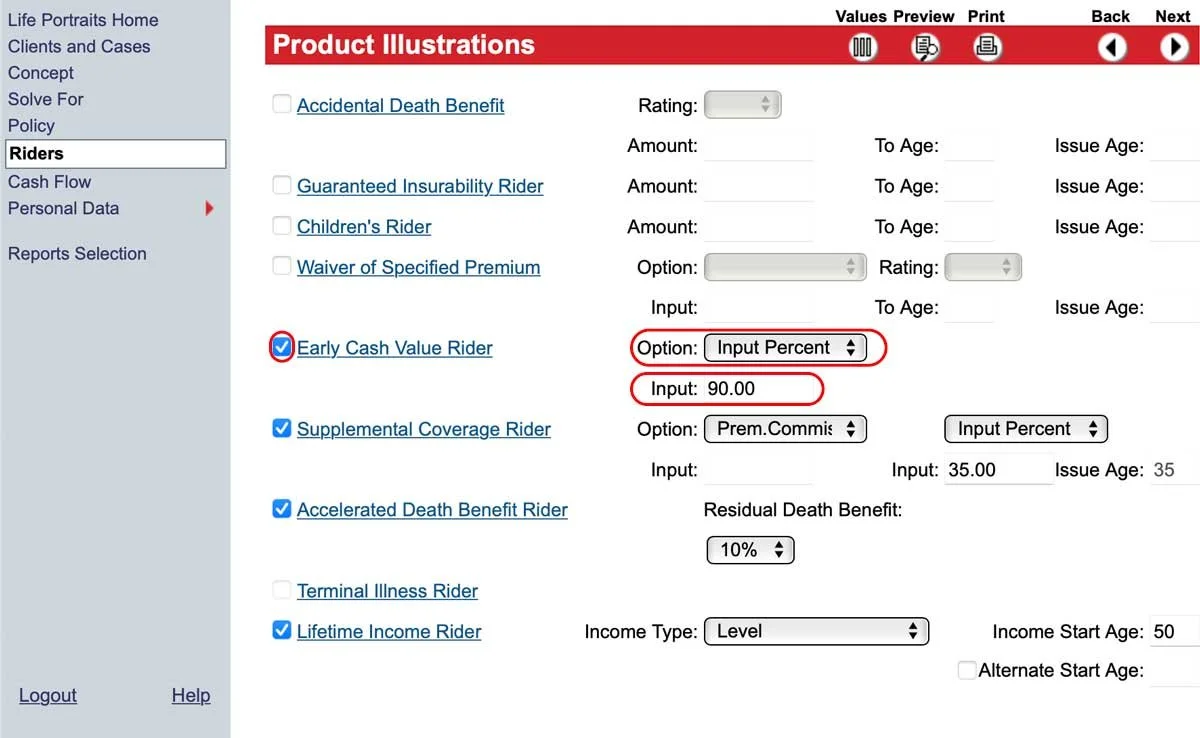
On the Riders, page, first check the “Supplemental Coverage Rider” checkbox, and then pick the following options for the following fields:
Under “Option,” select “Premium. Commissionable.”
On the next drop-down box to the right of that, select “Input Percent”
For the Input underneath “Input Percent,” enter “35.”

Now click on “Early Cash Value Rider” and input the following information:
Option: “Input Percent”
Input: “90.”

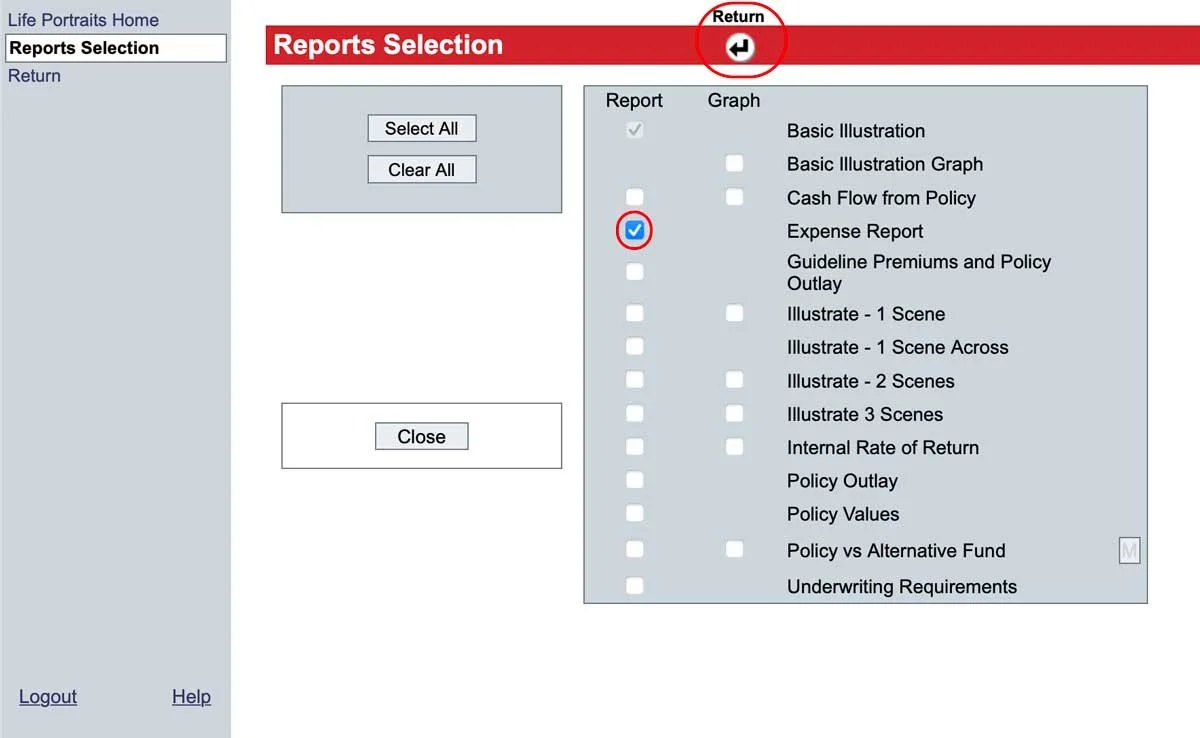
Click on the “Reports Selection” on the left:

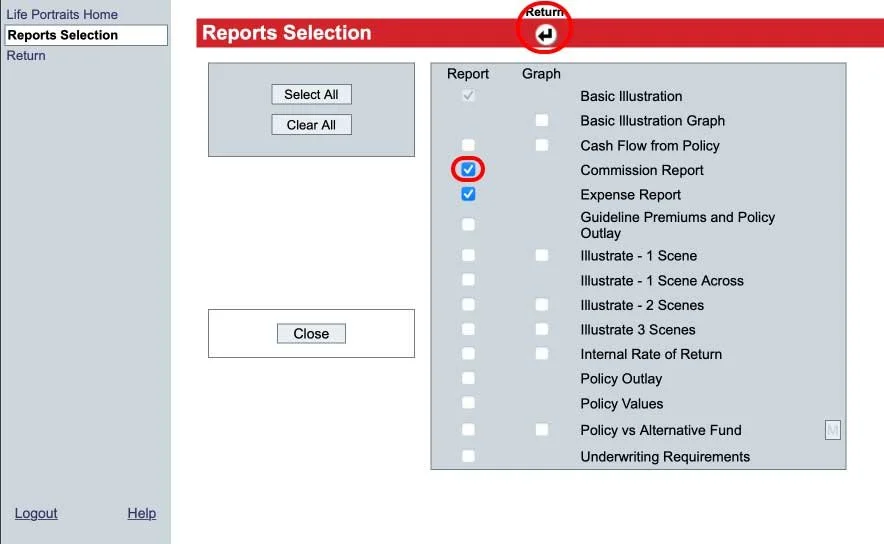
Click to turn on the checkmark for “Expense Report.” We also want the Commission report included, but it is not listed among the options. This requires a little bit of a hack through a glitch. To start the hack, click “Return” at the top.
This is where the glitch is revealed. When you check the Expense Report and then hit “Return,” it will kick you back to the Riders page, and the “Early Cash Value Rider” will not be checked anymore. So you have to check it again and then input the same information you already inputted. So do it again.
Once it is in again, click on the “Reports Selection” button on the right again.
Hack successful! This will make the “Commission Report” option available. Check the box and then hit “Return.”
You will be back on the “Riders” page. Click on “Policy” on the left:

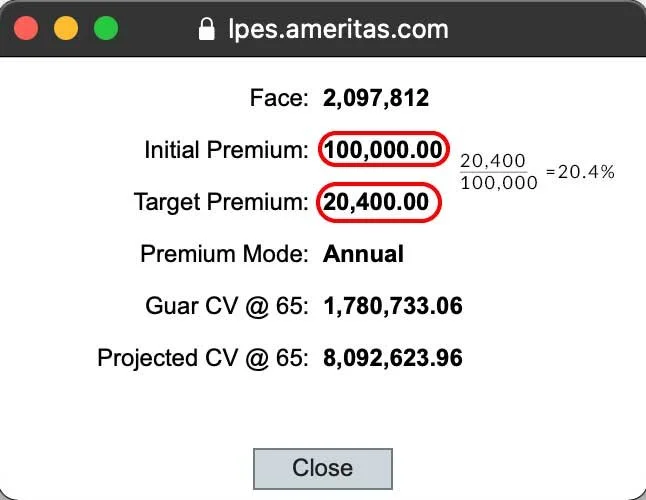
Here is where the trial and error portion begins. Click on “Quick Calc …”

This will bring up a little window that shows a few figures based on your design. You want the Target Premium to be 35% of the Initial Premium. In my example, using my numbers, we were only at 20.4%:
We’re going to close that window and go back to our “Product Illustrations” page. We need to increase the death benefit and try again. I was at $2M before. Now I am going to try $4M to see where that gets me (if you are above 35%, then you’ll need to decrease the death benefit).
After I input those numbers, I am going to hit “Quick Calc…” again:

This gets me a lot closer, but at 36.975%, I need to back it off slightly:

I do this a couple more times, getting closer every time. After one or two more tries, I discover that for this client, inputting $5,000,000 gets me right where I need to be:


Now that we have all the calculations correct, click on the “Values” button up top:

This will lay out the illustration table for you. To get the full PDF illustration, click “Preview” at the top right:
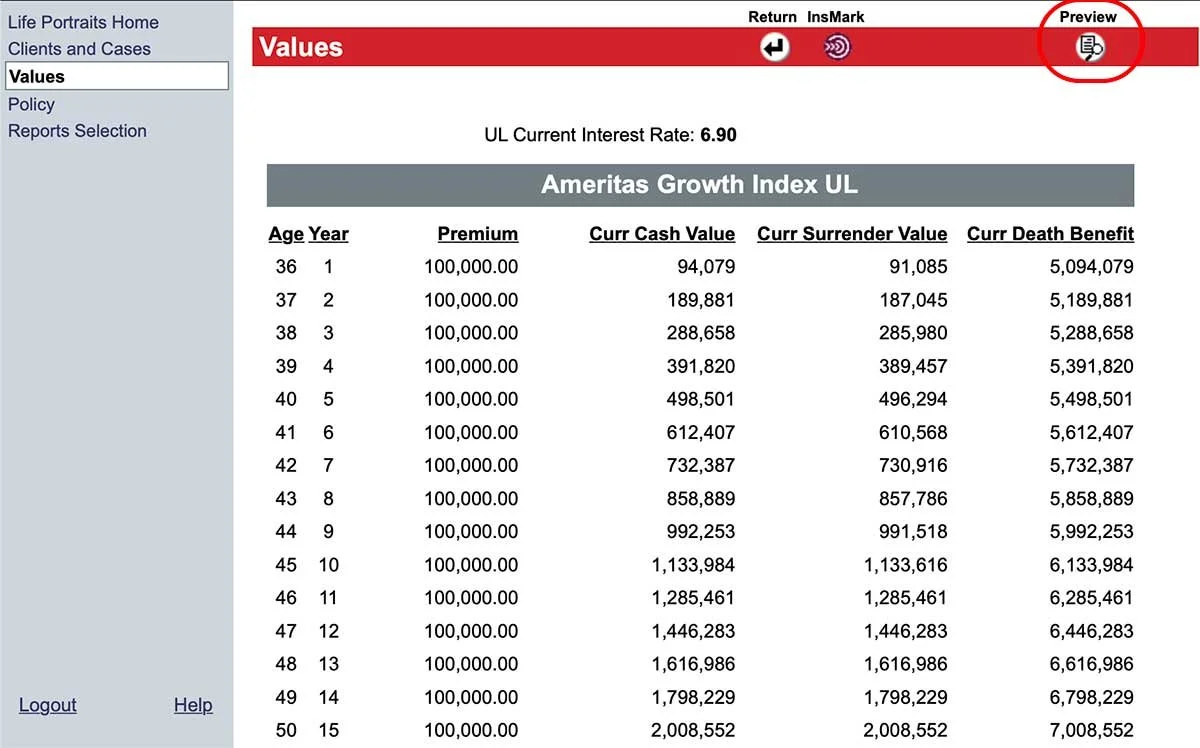
Your illustration should look like this at the top of the first page. If it is a different color or style, you’ve probably selected the wrong product:
